Citigroup Inc C stock technical analysis for October 08, 2010
Support & Resistance Levels - 10/8/10
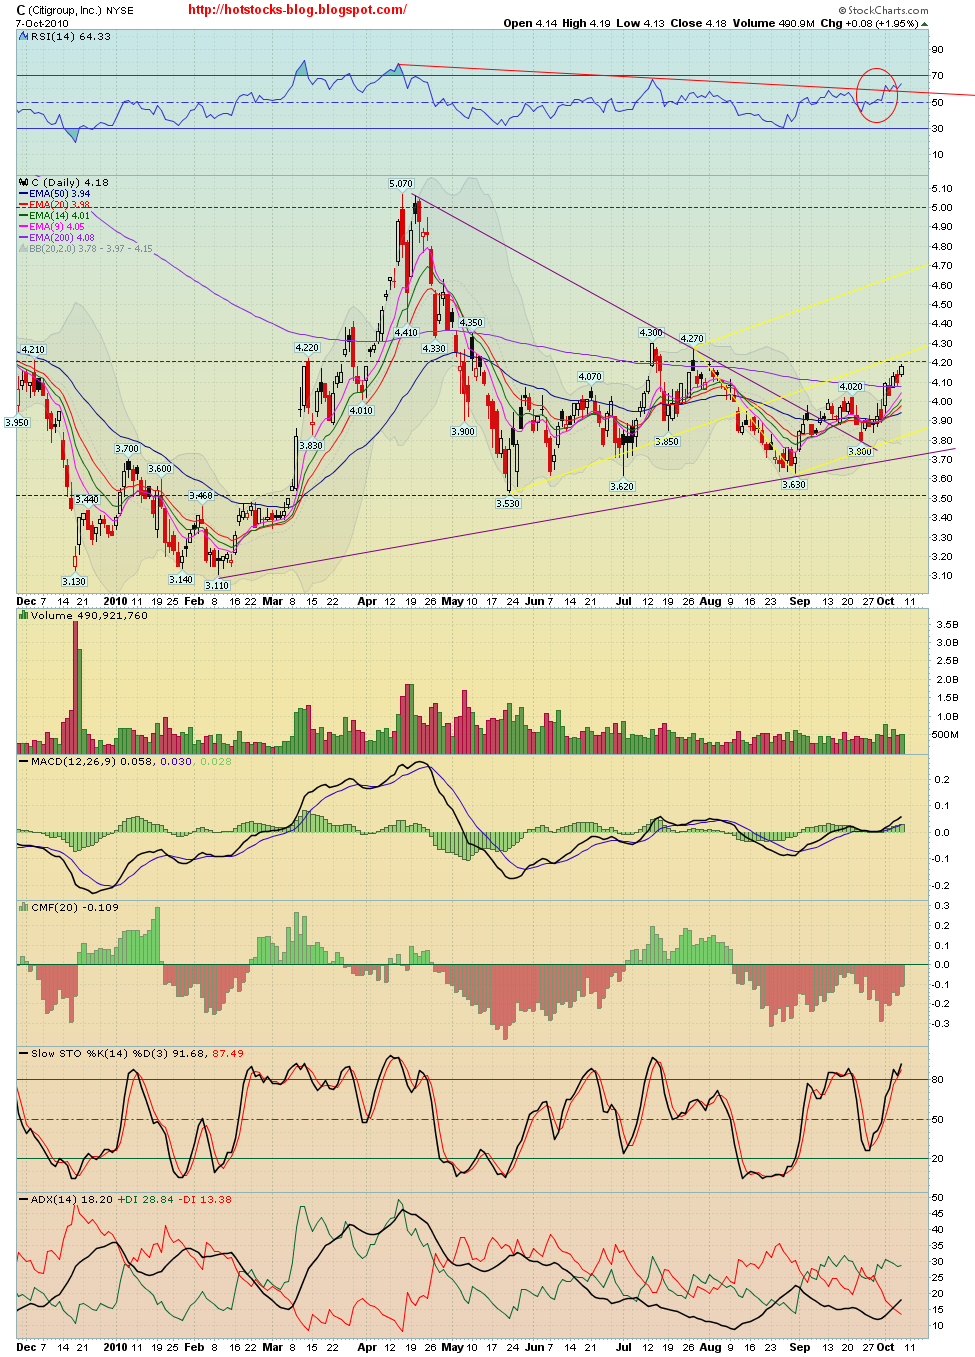
Resistance levels: $4.25, $4.22, $4.20
Support levels: $4.14, $4.10, $4.08
Share of Citigroup Inc is trading over $4.10 which is bullish.I want to see stock close over $4.30 that will new uptrend level.Stock is trading over $3.80 which short term bullish is next key support level is $3.53 which long term support area.For bullish side stock should be stray over $4 area.But if stock break over $4.20 stock could go $4.30-$4.50 next level.I will buy more for long side.I will buy more $4.20 area for safer side.For long term investment stock is buy this level.Long run stock could be see double in $6-$8 , next 12 months.
You want to find out more Technical Analysis -Go Here
Good Luck .. Trade Smart!
For the latest updates on the stock market, visit,
http://hotstocks-blog.blogspot.com/ or Subscribe for free.

